Hello!

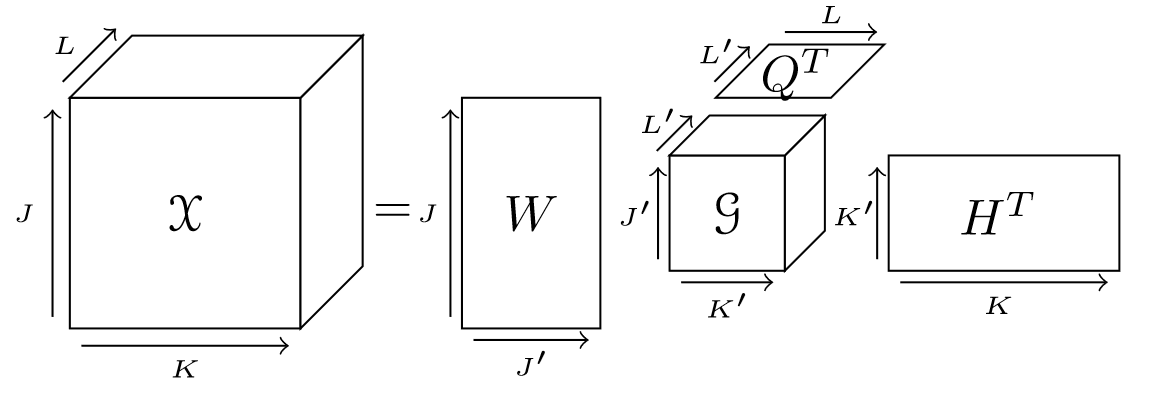
This Notebook is associated with the ICASSP2022 submission, presenting audio outputs of the Nonnegative Tucker Decomposition (NTD) when optimizing different loss functions. In particular, the three evaluated loss functions are three special cases of the more general $\beta$-divergence:

More details about our algorithm are to be found in the ICASSP submsission (which should be the reason of your presence on this page). Audio signals are obtained by applying the Griffin-Lim algorithm to STFT.

This notebook will present signals, showing results of:

Note though that signals representing songs will be limited to the first 16 bars, in order to limit the size of this HTML page.

We insist on the fact that, while audio signals are listenable, they are not of profesional musical quality either due to inaccuracies in the decomposition or due to the phase-estimation algorithm that we use (Griffin-Lim). Improving the reconstruction of these signals could constitute future work.

In the meantime, we believe that these audio examples are good examples of the potential and outputs of the NTD, and allow to qualitatively evaluate the differences between the different loss functions.

Imports

Let's start with importing external librairies (which are installed automatically if you used pip install, otherwise you should install them manually).

And now, let's import the nn_fac and MusicNTD code (respectively code for Nonnegative Factorizations methods and for everything else (data manipulation, segmentation, etc) associated with NTD for music segmenation):

Next, we need to load the song to decompose. We used Come Together from The Beatles as example, but feel free to chose any song you'd like! (in wav though.)

NB: this comment only applies of you're compiling the Notebook, and not reading the HTML, as the HTML is static.

STFT

Let's compute the STFT of the song:

and then form the tensor-spectrogram of this STFT:

We reconstruct the song from the unfolded tensor spectrogram. Hence, the song will be reconstructed from the 96 chosen samples per bar.

To reconstruct the song, the algorithm needs the hop length of the STFT. As bars can be of different length, we compute the median hop length from the different bars, and applies it to all bars in our song.

Now, let's recreate the signal from the barwise STFT, in order to study the reconstruction quality of the Griffin-Lim algorithm. We limit the song to a certain number of bars (not to overload the final HTML file).

Let's hear it:

We already see some artifacts coming from the reconstruction. Hence, reconstructed signals won't be better than this one, which is already disturbed.

NTD: Nonnegative Tucker Decomposition

Let's compute the NTD of this tensor-spectrogram, and study the reconstructed signal and the barwise patterns obtained in the decomposition.

As a recall, NTD is a tensor decomposition method, which can be used to retrieve patterns from data.

We refer to the ICASSP submission or to [1] for details.

First, we need to set the dimensions of the decomposition, corresponding to the core dimensions. They have set empirically here.

$\beta$ = 2: Euclidean nom

Below is executed the NTD with the HALS algorithm, optimizing the euclidean norm ($\beta$-divergence with $\beta = 2$) between the original and the reconstructed tensor.

$\beta$ = 1: Kullback-Leibler divergence

Below is executed the NTD with the MU algorithm optimizing the Kullback-Leibler divergence ($\beta$-divergence with $\beta = 1$) between the original and the reconstructed tensor.

$\beta = 0$: Itakura-Saito divergence

Below is executed the NTD with the MU algorithm optimizing the Itakura-Saito divergence ($\beta$-divergence with $\beta = 0$) between the original and the reconstructed tensor.

Listening to the reconstructed songs

Having decomposed the song with the 3 different losses, we will now compare the resulting decompositions by listening to the resulting factorization.

Hence, we unfold the NTD results and use the Griffin-Lim algorithm to reconstruct a signal.

We hear a particularly strong difference (in our test example) between $\beta = 2$ and both $\beta = 1, 0$.

Both $\beta = 1, 0$ seem to capture melodic lines in the song, while $\beta = 2$ seems to focus on rhythmic and low-frequential aspects.

Listening to all patterns

The interesting aspect of NTD is its supposed ability to capture patterns in the song, as discussed in [1].

Hence, by computing the appropriate products, we can recompose the spectrograms forming each pattern, and use the Griffin-Lim algorithm to reconstruct these STFT into signals. This is what is made in the following cells, where every listenable file correspond to a pattern obtained in the decomposition (12 for each $\beta$ value in our example).

Again, we concluded empirically that both $\beta = 1, 0$ were able to capture more interpretable patterns in terms of human perception than $\beta = 2$.

References

[1] Marmoret, A., Cohen, J., Bertin, N., & Bimbot, F. (2020, October). Uncovering Audio Patterns in Music with Nonnegative Tucker Decomposition for Structural Segmentation. In ISMIR 2020-21st International Society for Music Information Retrieval.